People reached
Across learning, water, food, and livelihood programs.
Transparent fictional metrics demonstrating how a nonprofit can show progress without hiding complexity.
Across learning, water, food, and livelihood programs.
Schools, resident groups, clinics, and community organisations.
Contributing time, knowledge, logistics, and neighbourly care.
Illustrative percentage directed to programs and support.
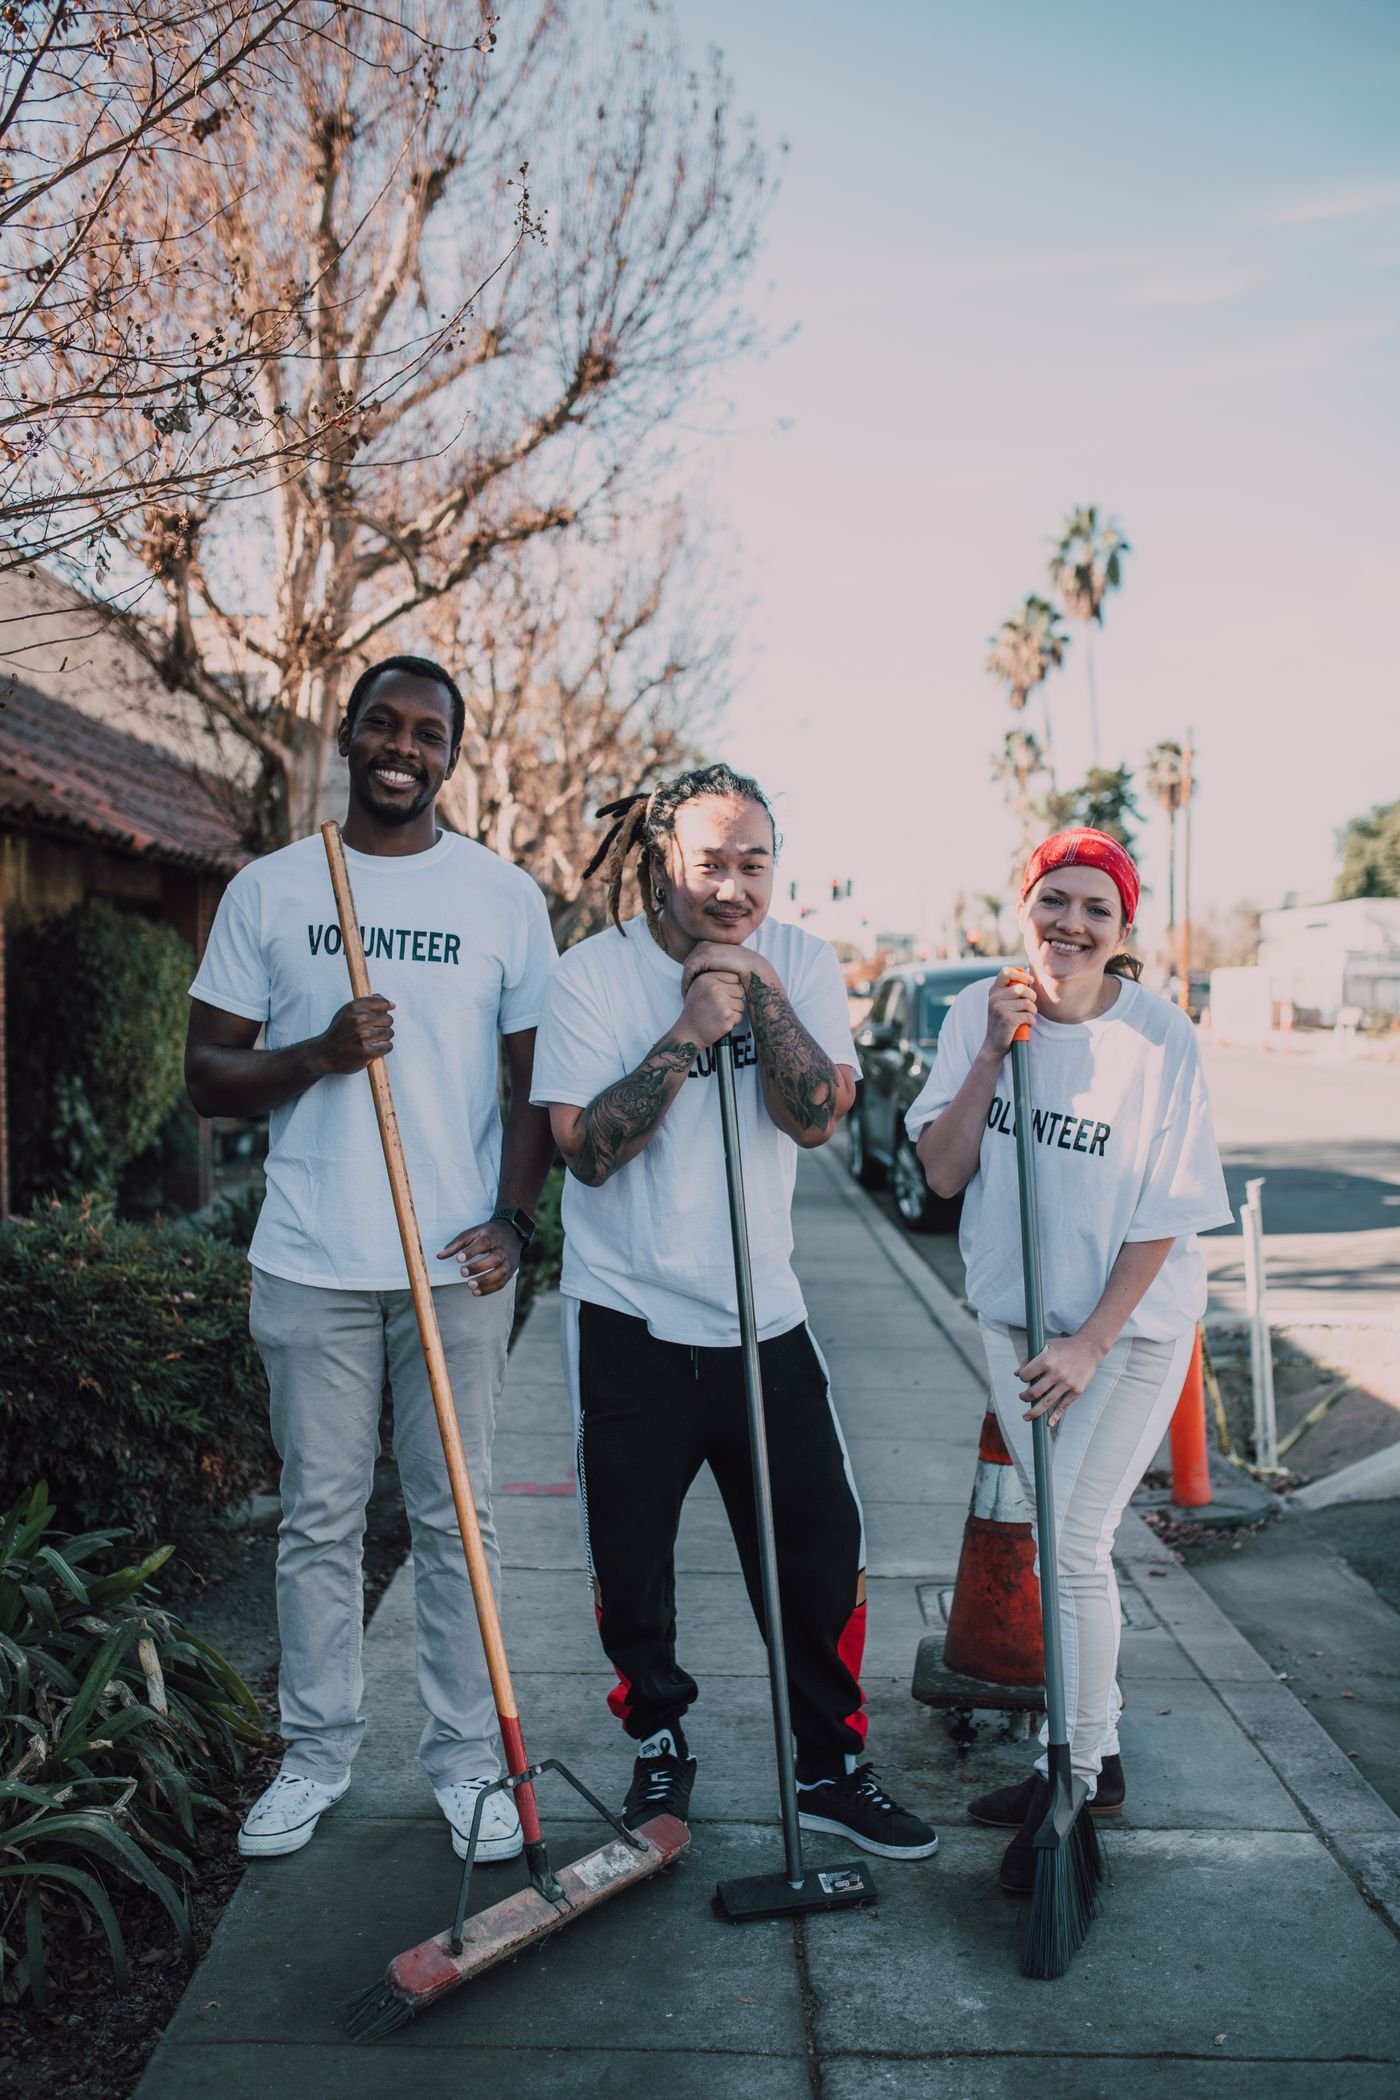
We pair outputs with participant feedback, local partner review, and honest notes on what did not work. Every fictional program is reviewed against relevance, access, quality, and long-term ownership.
Read the human context ↗Participants define what meaningful progress looks like.
Evidence shapes adaptation, not just annual reporting.
Results, limitations, and spending stay visible.